
The Smoky Mountain real estate market continues to evolve as we move through early 2026. With shifting inventory levels, changing buyer demand, and dynamic short-term rental (STR) performance trends, February offers valuable insights for both buyers and sellers. Let’s break down the latest February 2026 STR and sales trackers to see what this data means for you.
February 2026 Sales Stats
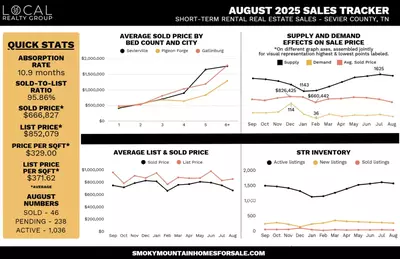
February’s numbers reflect a market that is still active but clearly adjusting:
- Absorption rate: 8.4 months
- Sold-to-list ratio: 93.73%
- Average sold price: $648,573
- Average list price: $720,605
- Average price per sq ft: $324.40
- Average list price per sq ft: $385.33
- Sold: 42
- Pending: 276
- Active: 904
The 8.4-month absorption rate signals a shift toward a more balanced or even buyer-leaning market. Properties are still selling, but buyers have more leverage than they did during peak demand periods.
Supply & Demand Trends

Looking at trends over the past year, average sold prices peaked in late 2025, reaching over $870,000 in December, before declining to their lowest at $648,573 in February 2026. This downward movement suggests that increased inventory and moderating demand are influencing pricing. At the same time, active listings have grown significantly, with 904 properties currently on the market. While pending sales remain strong at 276, the gap between supply and demand has widened. This dynamic is creating more opportunities for buyers to be selective and negotiate.
Average Sold Price by Bed Count & City
Property size continues to play a major role in pricing across the Smoky Mountain real estate market. As of February 2026, larger cabins still command premium prices, especially in high-demand areas, and prices continue to vary significantly by bedroom count and location:
Sevierville
- 1 Bed: $434,294
- 2 Bed: $516,001
- 3 Bed: $657,458
- 4 Bed: $907,515
- 5 Bed: $1,488,683
- 6+ Bed: $1,731,894
Pigeon Forge
- 1 Bed: $450,993
- 2 Bed: $513,608
- 3 Bed: $619,497
- 4 Bed: $845,383
- 5 Bed: $1,106,500
- 6+ Bed: $1,200,000
Gatlinburg
- 1 Bed: $441,059
- 2 Bed: $568,198
- 3 Bed: $750,255
- 4 Bed: $979,538
- 5 Bed: $1,123,767
- 6+ Bed: $1,733,250
STR Market Performance

February’s data reveals some important trends in short-term rental performance:
- Average occupancy rate: 23.2%
- Average daily rate: $441.33
- Booking lead time: 37 days
- Average monthly revenue: $3,090.85
- Average days on market: 119.4
While nightly rates remain strong, occupancy levels are low, which is impacting overall revenue. This is most likely due to softer seasonal demand this time of year and should improve in the coming months.
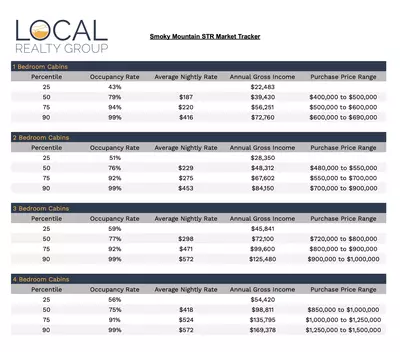
Cabin Performance by Size
Breaking down STR performance by cabin size gives us a few key takeaways:
- 1-bedroom cabins have the highest occupancy (26%) but still produced negative cash flow.
- 2- to 4-bedroom cabins hover between 20 and 22% occupancy
- Larger cabins (5+ bedrooms) show slightly improved occupancy but significantly higher expenses
Across all cabin sizes, estimated cash flow remains negative, and ROI ranges from approximately -13% to -20%. This indicates that many properties are not currently generating positive returns based solely on rental income. However, STR investors should view this data through seasonal lenses. The upcoming spring and summer months typically bring stronger occupancy and revenue, improving annual cabin performance.
What This Means for Sellers & Buyers

For sellers, this Smoky Mountain real estate data highlights the importance of pricing strategically. With a sold-to-list ratio under 94% and increasing inventory, overpricing can lead to extended time on market. Sellers who align with current market conditions are more likely to secure a sale.
For buyers, this is one of the most favorable environments seen in recent years. Increased inventory, softening prices, and longer listing times create opportunities to negotiate better deals, especially on short-term rental investment properties. STR investors should, however, approach purchases with a careful eye on performance metrics. Lower occupancy rates and negative cash flow trends mean due diligence is more important than ever.
Learn More About Smoky Mountain Real Estate Investment
Whether you’re buying your first cabin or expanding your STR portfolio, understanding the latest market data is key to making informed decisions. Our experienced team at Local Realty Group specializes in Smoky Mountain real estate and can help you navigate today’s changing market with confidence. From analyzing investment potential to identifying the best opportunities, we’re here to guide you every step of the way. Contact us today to get expert insight to help you reach your investment goals!