
As 2025 winds down, the latest STR sales data for the Smoky Mountain market paints an interesting picture. The short-term rental market is not collapsing, but it is definitely shifting. For new and seasoned investors, understanding these trends is critical. Below we break down the key data from the November 2025 STR sales tracker and what it means for you.
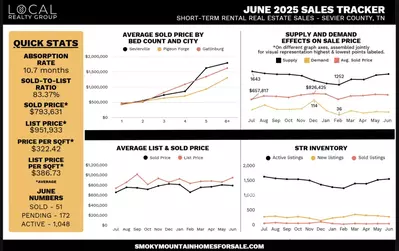
Average Sold by Bed Count and City
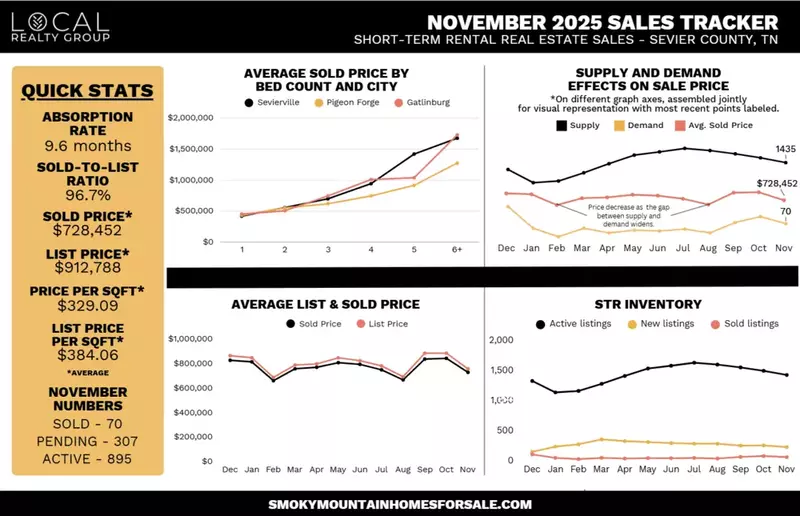
The November 2025 STR sales tracker reveals how performance varies by property size and location. Gatlinburg tends to command higher prices across most bed counts, with the exception of 2-bedroom and 5-bedroom units. Pigeon Forge tends to offer more affordable price points, with the lowest average sold prices for 3+ bedroom units. Sevierville shows strength in the larger units, with the highest sold prices for 5-bedroom units. For investors looking for lower cost and lower maintenance entry properties, 1- and 2-bedroom units in Pigeon Forge or Gatlinburg may offer the best balance of affordability and consistent demand. For those targeting mid-range rentals with better cash flow potential, 2- and 3-bedroom units, especially in Sevierville or Gatlinburg, could provide good returns. For investors aiming at higher capacity, larger group rentals (5+ bedrooms), Sevierville may be the most favorable city.
Supply and Demand Effects on Sale Price
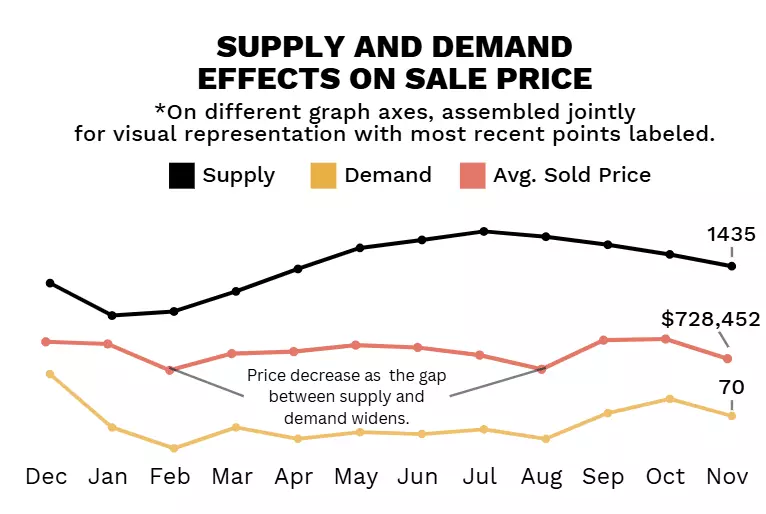
The November 2025 STR sales tracker shows a clear relationship between supply, demand, and the resulting impact on average sold price. This year, supply climbed steadily from winter into mid-summer, peaking around July, before tapering slightly through November. Meanwhile, demand began strong in December, fell sharply into February, then slowly rebuilt through fall before dropping slightly in November. Sale prices soften whenever the gap between high supply and low demand widens. This dynamic is especially evident from February through August, when average sold price trended downward despite seasonal activity. Only when demand began to rebound in September did prices rise again, peaking before cooling in November. This month’s tracker shows a classic pattern: larger inventory plus weaker demand puts downward pressure on STR sale prices, while narrowing the gap brings pricing stability.
Average List and Sold Price
In the November 2025 STR sales tracker, the comparison of list prices to sold prices offers additional clarity. It now shows a consistent and predictable relationship between seller expectations and actual market performance. List prices remain slightly above sold prices, reflecting normal negotiation margins in the Smoky Mountain STR market. Both metrics follow similar trends, dipping to their lowest in February before climbing steadily through spring and early summer. May and June marked the annual high, followed by a late-summer decline and a sharp rebound in September (one of the strongest pricing months of the year). Prices then softened heading into November. Overall, this reveals a balanced market in which sold prices closely track list prices, indicating realistic seller pricing and relatively stable buyer demand despite seasonal fluctuations.
STR Inventory
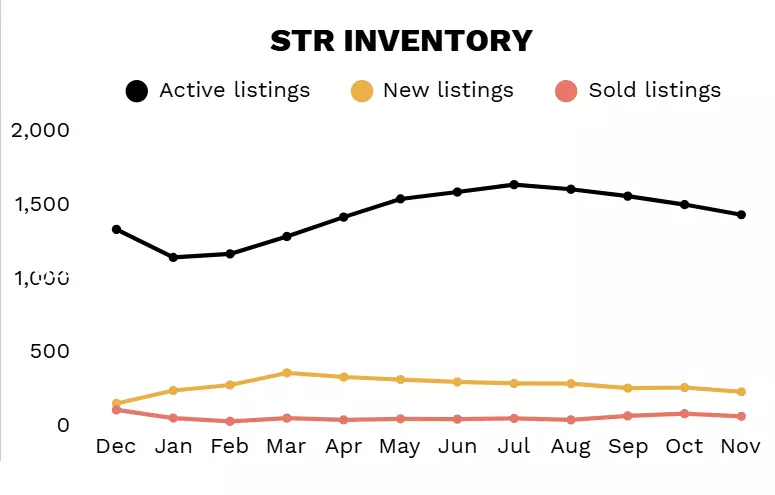
The November 2025 STR sales tracker highlights the relationship between active, new, and sold listings. Active listings steadily climbed through the spring, reaching a high point in mid-summer. This gradual increase reflects a growing supply in short-term rental properties coming to market during peak buying months. New listings surged early in the year before tapering off consistently through the summer and fall. Sold listings, on the other hand, remained relatively flat, showing that closings stay consistent even as inventory expands. The widening gap between active listings and sold listings during summer indicates a more competitive environment for sellers, while the decline in new listings toward the year’s end helps moderate total inventory heading into November. Overall, this data reinforces a market where supply swells faster than demand, driving a more selective and strategy-driven environment for STR buyers and sellers.
Quick Stats for November 2025 STR Sales
- Absorption Rate: 9.6 months
- Sold-to-List Ratio: 96.7%
- Average Sold Price: $728,452
- Average List Price: $912,788
- Average Price Per Square Foot: $329.09
- Average List Price Per Square Foot: $384.06
- Sold Units: 70
- Pending Units: 307
- Active Units: 895
Invest in Smoky Mountain Short-Term Rentals
If you’ve been considering adding a Smoky Mountain short-term rental property to your investment portfolio, now might be a particularly strategic time. Patient buyers have more negotiating power now and may be able to secure deals that were impossible during prior heated periods. There’s real opportunity here for investors willing to be selective, strategic, and patient. If you’re ready to get started, check out our current Smoky Mountain homes for sale to find the right opportunities for your next STR investment.